Timing 201 #10: The Case of the Really Slow Jitter – Part 2
Author: Kevin G. Smith
Introduction
Welcome to the second Timing 201 blog post on the topic of wander, aka really slow jitter.
Last time, I reviewed wander versus jitter, the motivation for understanding wander, and discussed Maximum Time Interval Error (MTIE), an important wander standards metric. I originally planned to discuss Time Deviation (TDEV) next, an equally important wander metric. However, in reviewing the material, I realized it is best to first understand what led to the predecessor metric Allan Deviation (ADEV). So, that is the topic I will focus on today.
A Brief Recap
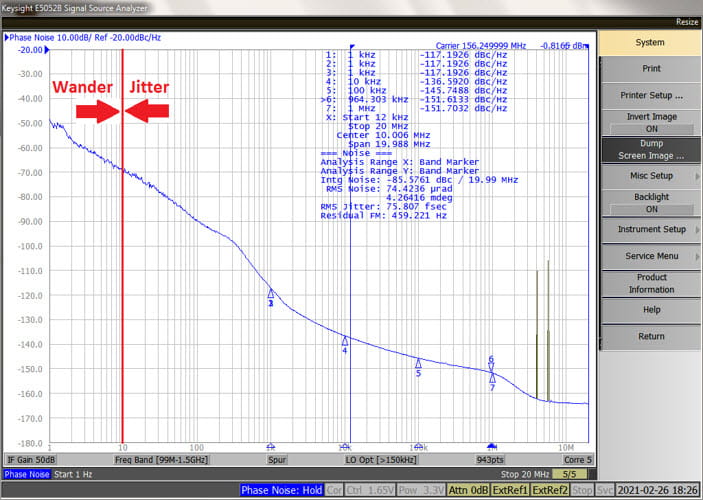
You will recall from the previous post [1] that 10 Hz is the usual dividing line between wander and jitter. Phase noise at offset frequencies below 10 Hz is regarded as wander, while anything at or above 10 Hz is regarded as jitter.
Standards bodies such as the ITU rely on masks that provide limits to wander specs based on MTIE and TDEV. See for example ITU-T 8262 [2]. As noted last time, MTIE looks at peak-peak clock noise over intervals of time and is very useful for sizing data buffers in telecommunications applications.
ADEV is TDEV’s Predecessor
TDEV is one of a number of special deviation statistics. It can be derived from the Modified Allan Deviation or MDEV which, as the name implies, is derived from Allan Deviation. In fact, the Allan Deviation is the forerunner of several special deviation statistics including TDEV, which is why it is worth our consideration. For an overview of variances used in frequency stability analysis, see section 5.2 in the Handbook of Frequency Stability Analysis by W.J. Riley [3].
In today’s post, I will cover these main points:
- Oscillator noise can be modeled as power-law processes.
- Such power-law processes limit the usefulness of standard deviation for analyzing frequency stability.
- Allan deviation is an improvement over standard deviation for analyzing frequency stability.
Oscillator Power-Law Noise Processes
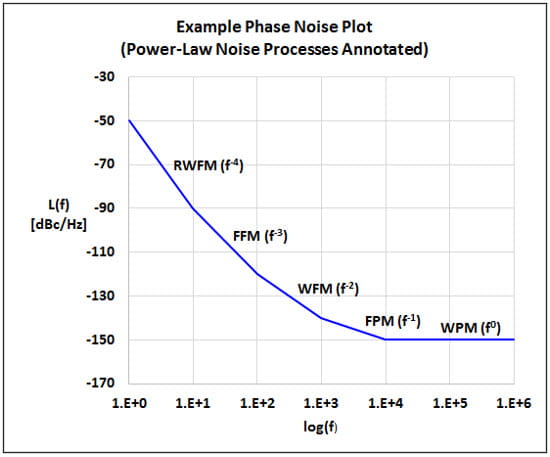
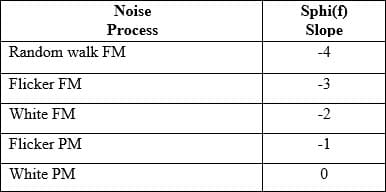
Oscillator instabilities can be modeled as combinations of power-law noise contributions on log-log plots whose slopes change depending on the function and whether the plot is in the frequency or time domain. For example, per IEEE Standard 1139-2008 [4], the following slopes apply for a phase spectrum Sphi(f) log-log plot. FM and PM refer to Frequency Modulation and Phase Modulation respectively. White PM noise is random and uncorrelated. All the other noise processes are random but correlated.
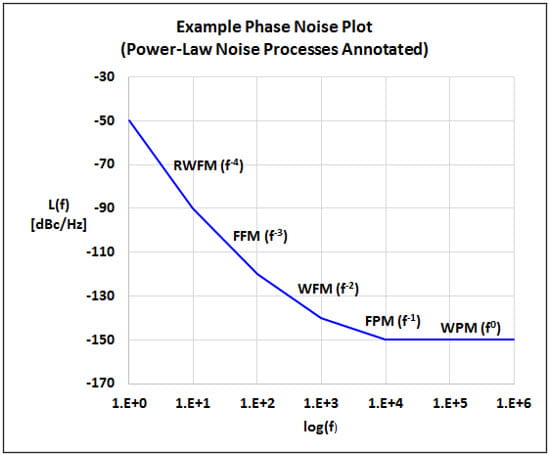
Since phase noise “script L” or L(f) as shown here is ½ of Sphi(f), the same slopes apply as in the annotated figure below [5]. This example phase noise plot shows regions where the different power noise processes apply. Note that this is just an example and not all oscillators will exhibit all of these processes, which can be caused by electronics or the operating environment.
Standard Deviation
You will recall that the standard deviation is a statistic that measures how “spread out” or dispersed a set of numbers is from the mean. The standard deviation s is the square root of the standard variance s^2, which can be written out like the following for N samples:
|
s^2 = 1/(N-1) * Sum [(y_i – y_mean)^2]
|
Where
y_i = ith sample
y_mean = mean sample value
Sum = summation of the argument from i = 1 to N samples
A potential problem that can occur is if the mean value is a moving target, i.e., if it changes significantly with the number of samples. This problem can occur when studying frequency stability due to the power-law noise processes discussed above.
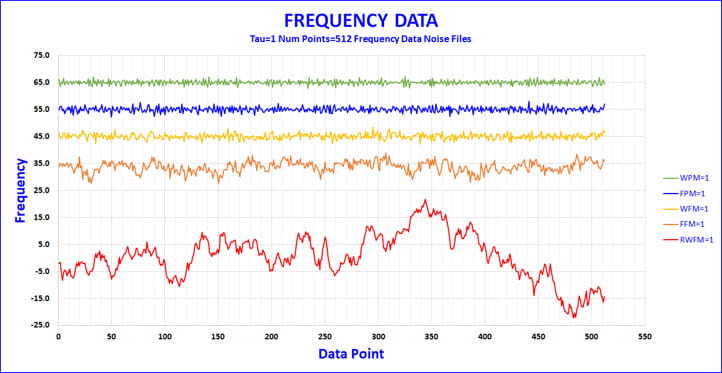
There is an excellent software tool, Stable32, written by William Riley for frequency stability and wander analysis. It is available for free from the IEEE Ultrasonics, Ferroelectrics and Frequency Control Society (UFFCS) [6]. Stable32 can be used to import frequency counter data and analyze it in terms of frequency or phase (time).
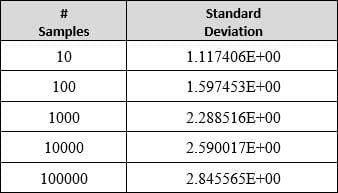
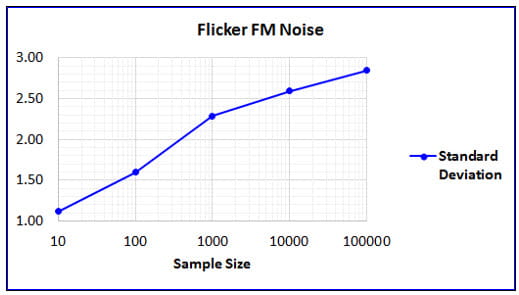
One of the many useful features of this tool is that you can also generate frequency and phase time series data with varying combinations of these power-law noise processes. You can then observe what happens when applying the standard deviation to noisy data sets of varying sample sizes. Below is a table and plot showing the divergence of the standard deviation when applied to Flicker FM (f^-3) noise data. As you can see in the figure the standard deviation diverges (increases) with sample size, which is undesirable and limits its usefulness.
Allan Deviation
The Allan deviation, named after David Allan, was developed at the National Bureau of Standards (NBS), now the National Institute of Standards and Technology (NIST), in the 1960s to overcome the divergence problem when studying frequency stability [7]. It is the square root of the Allan Variance, a 2-sample variance that looks at the first differences in fractional frequency or the second differences in phase.
The modern form of this statistic that is most used is the Overlapping Allan Variance. See section 5.2.4 in the Handbook of Frequency Stability Analysis [3]. The corresponding Allan Deviation can be written out for phase as:
|
ADEV (m*tau0) = SQRT {(1/(2*(N-2m)*(m*tau0)) * Sum [x_i+2m – 2x_i+m + x_i]^2 }
|
Where
x_i = ith time error samples
N = total number of samples
tau0 = time error sampling interval
m = number of sampling intervals or AF (Averaging Factor)
Sum = summation of the argument from i = 1 to N-2m
To further demonstrate how the overlapping ADEV calculation works, I have generated a spreadsheet where I took some sample data and directly crunched the numbers as shown above. The results matched Stable32 exactly. See the attached spreadsheet,
201-10_Overlapping_AVAR_ADEV_Example.xlsx.
Now, if we go back to the Stable32 tool and compare the Allan Deviation (for m=1 only) versus the Standard Deviation, we will see something like the following results:
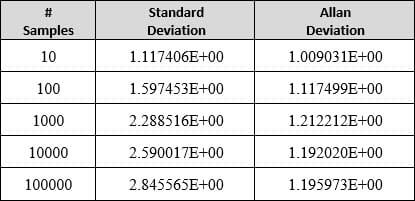
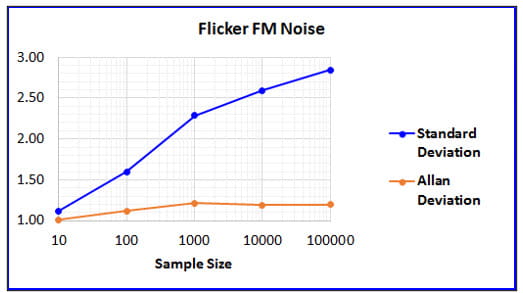
Note that this exercise is replicated after Figure 6 in the Handbook of Frequency Stability Analysis [3]. The results are similar but not identical as the noise source files change every time they are generated. In this case, I set the Stable32 Noise Parameter for Flicker FM = 1 and kept all the other parameters set to 0.
As the figure illustrates, the Allan deviation does not diverge with sample size, a great improvement over the standard deviation. This is a much more convenient and useful statistic for making “apples to apples” comparisons between frequency stability data sets of varying sample size.
Conclusion
In this post, I have discussed Allan Deviation (ADEV) as a necessary stepping stone to understanding Time Deviation (TDEV), which I will cover next time.
I hope you have enjoyed this Timing 201 article.
As always, if you have topic suggestions or questions appropriate for this blog, please send them to kevin.smith@skyworksinc.com with the words Timing 201 in the subject line. I will give them consideration and see if I can fit them in. Thanks for reading. Keep calm and clock on.
Cheers,
Kevin
References
- K. Smith, "Timing 201 #9: The Case of the Really Slow Jitter – Part 1", Timing 201. 2021.
https://www.skyworksinc.com/Blog/2022/10/Timing-201-09
- ITU-T G.8262 Timing characteristics of a synchronous equipment slave clock. ITU, 2019 [Online]. Available: https://www.itu.int/rec/dologin_pub.asp?lang=e&id=T-REC-G.8262-201811-I!!PDF-E&type=items. [Accessed: 26- May- 2021]
- W. Riley, Handbook of Frequency Stability Analysis, NIST Special Publication 1065. NIST, 2008 [Online]. Available: https://tf.nist.gov/general/pdf/2220.pdf. [Accessed: 26- May- 2021]
Note: A version of this handbook and many other excellent related papers are available on Mr. Riley’s Hamilton Technical Services website at https://www.wriley.com/.
- "1139-2008 - IEEE Standard Definitions of Physical Quantities for Fundamental Frequency and Time Metrology---Random Instabilities", Ieeexplore.ieee.org, 2008. [Online]. Available: https://ieeexplore.ieee.org/document/4797525. [Accessed: 26- May- 2021]
- D. Leeson, "Oscillator Phase Noise: A 50-Year Review", IEEE Transactions on Ultrasonics, Ferroelectrics, and Frequency Control, vol. 63, no. 8, pp. 1208-1225, 2016 [Online]. Available: https://ieeexplore.ieee.org/stamp/stamp.jsp?arnumber=7464875. [Accessed: 27- May- 2021]
- W. Riley, "Stable32 - Software for Frequency Stability Analysis, by William Riley | IEEE UFFC", IEEE UFFC, 2018. [Online]. Available: https://ieee-uffc.org/download/stable32-software-frequency-stability-analysis-william-riley/. [Accessed: 27- May- 2021]
- D. Allan and J. Levine, "A Historical Perspective on the Development of the Allan Variances and Their Strengths and Weaknesses", IEEE Transactions on Ultrasonics, Ferroelectrics, and Frequency Control, vol. 63, no. 4, pp. 513-519, 2016 [Online]. Available: https://tf.nist.gov/general/pdf/2834.pdf. [Accessed: 27- May- 2021]
Please note that as of last editing, the IEEE UFFC link appears to have changed to https://ieee-uffc.org/software#stable.
[Note: This blog article was originally posted online in June 2021. It has been lightly edited, and updated to reflect Skyworks Solutions’ acquisition of Silicon Labs’ Infrastructure and Automotive business, completed on July 26, 2021.]

By Kevin G. Smith
Sr. Principal Applications Engineer


