Timing 201 #11: The Case of the Really Slow Jitter – Part 3
Author: Kevin G. Smith
Introduction
After a long hiatus, the Timing 201 blog is starting back up again 😊. Previous Timing 101 and Timing 201 blog articles are now posted on the Skyworks website at https://www.skyworksinc.com/Blog. These articles have been lightly edited and updated to reflect Skyworks Solutions’ acquisition of Silicon Labs’ Infrastructure and Automotive business, completed on July 26, 2021.
The last couple of blog posts were Timing 201 #9: The Case of the Really Slow Jitter – Part 1 [1] and Timing 201 #10: The Case of the Really Slow Jitter – Part 2 [2]. These titles reflect the most general notion of jitter as described in the first sentence in [3]:
“Jitter” is the noise modulation due to random time shifts on an otherwise ideal, or perfectly on-time, signal transition.
Part 1 reviewed the more frequency-specific conventions for wander (long-term variations < 10 Hz) and jitter (short-term variations ≥ 10 Hz), the motivation for understanding wander, and introduced the metric Maximum Time Interval Error (MTIE). MTIE measures the peak-peak variation in TIE over varying observation intervals. This peak detector behavior over increasing observation periods is what gives MTIE plots their characteristic monotonically increasing appearance.
Part 2 showed how the Allan Deviation (ADEV) is an improvement over the standard deviation when sampling frequency sources with divergent noise such as Flicker FM. The standard deviation will diverge in such cases with increasing sample size whereas ADEV does not. ADEV accomplishes this by taking the first differences of the fractional frequencies or equivalently, the second differences in phase.
This Part 3 blog post will conclude this wander metric series by introducing 2 additional members of the Allan Deviation family: Modified Allan Deviation (MDEV) and Time Deviation (TDEV). As we will see, ADEV cannot distinguish between white and flicker phase noise and MDEV was developed to overcome this “blind spot”. TDEV in turn is a specially scaled version of MDEV which focuses on time stability.
A Refresh on Oscillator Noise Processes
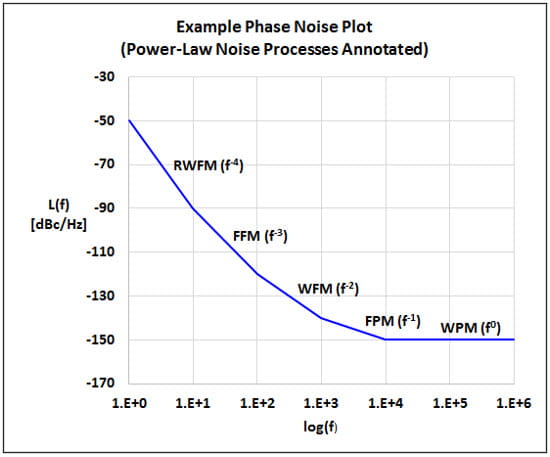
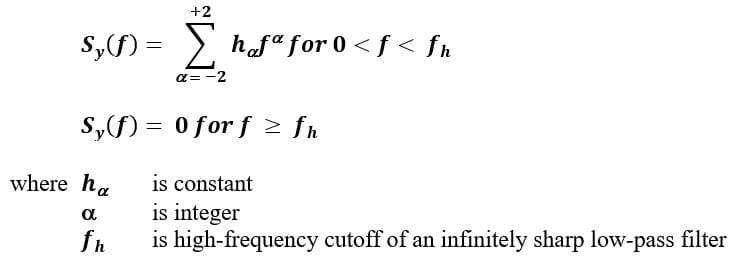
You may recall from Part 2 last time that oscillator power-law spectral densities may be modeled based on the sum of 5 different independent noise processes. Per IEEE Std 1139-2008 Annex B.1 [4], this can be expressed as:
Frequency domain log-log plot slope characteristics of these independent noise processes are listed as follows.
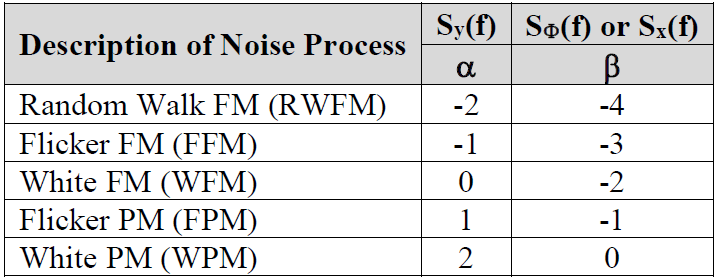
where S
y(f), S
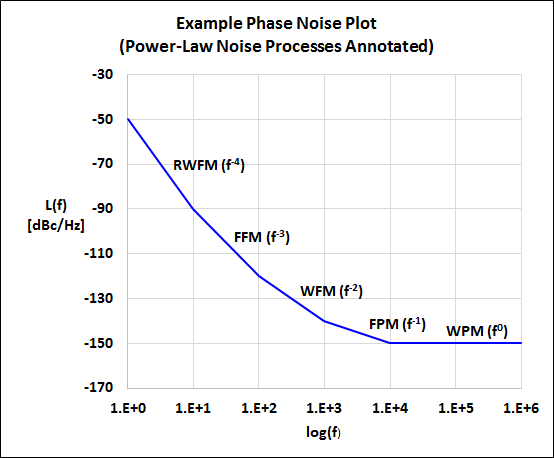
Φ(f), and Sx(f) refer to the one-sided spectral density of the normalized frequency fluctuations, phase fluctuations, and time fluctuations respectively. You may also recall that phase noise L(f) is defined as one-half of the phase spectrum SΦ(f). The "β" slopes are depicted in the example SSB phase noise plot below after [5]. We will discuss the slope characteristics of the time domain log-log plots later on.
This post, similar to the previous ones in this series, will rely on Stable32 the excellent frequency stability analysis software developed by William J. Riley, formerly with NIST, and available free via IEEE UFFC [6]. One of the great features of this software is the ability to generate noise with these parameters by specifying the levels or values for each of these 5 noise processes alone or in combination. The examples below use levels that are illustrative, not necessarily realistic.
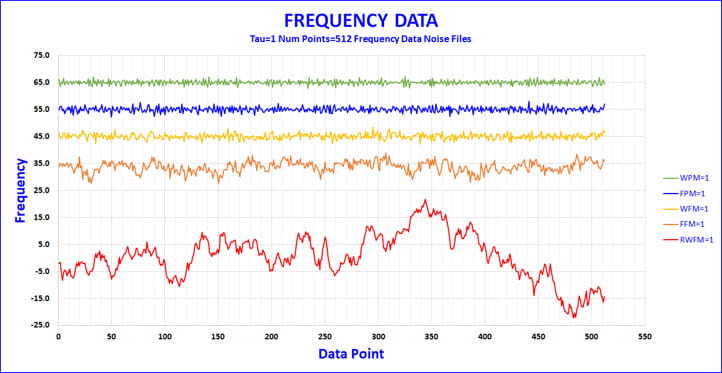
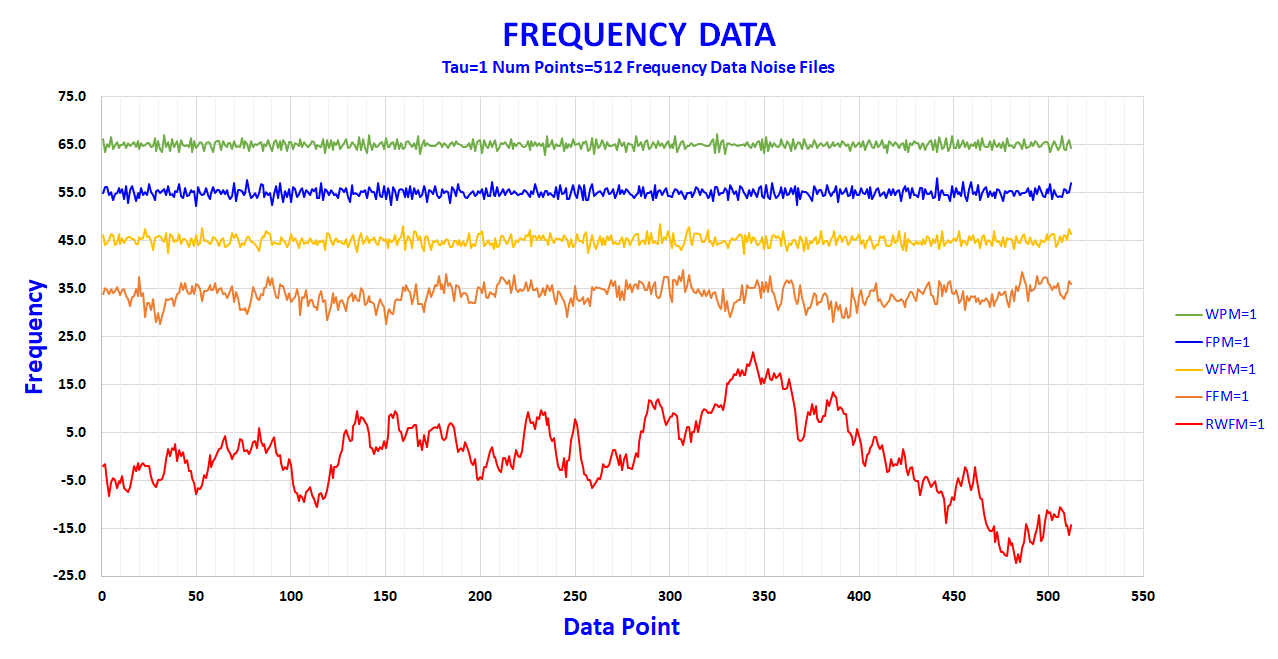
It is interesting to generate and compare the different noise types and plot the frequency data. The example plots below are for separately generated noise type data sets where each has its ha level set to 1, tau =1, and the number of frequency points is 512. The noise data sets are plotted offset from each other for clarity. In general, for the same parameter values, the peak-to-peak frequency variation increases going from the least divergent noise process White PM (α = 2, β = 0) to the most divergent noise process Random Walk FM (α = -2, β = -4).
ADEV’s “Blind Spot” to WPM vs. FPM
As discussed in Part 2 in this series, Allan Deviation improves over the standard deviation by analyzing how the fractional frequency varies from one time duration interval τ to the next. However, this calculation does have one “blind spot” so to speak.
To see what led to the development of the Modified Allan Deviation, consider the 2 least divergent noise types, WPM (α = 2, β = 0) and FPM (α = 1, β = -1). In the previous plot where all the levels are set to 1, the WPM and FPM plots appear very similar with the FPM noise having greater peak-peak variation. This is a little easier to see if they are plotted on top of each other but still relatively subtle.
Incidentally, it turns out you can hear the difference between these noise types more easily. Another nice feature supported by Stable32 is that you can listen to audio .wav files based on the generated noise. The most distinctive noise process is White PM which sounds closest to frying bacon. Flicker PM sounds relatively “harsher” than White PM to me but it is a bit hard to describe. <Note: You will most likely need to “Run as administrator” in order for Stable32.exe to be able to generate and play .wav files.>
Now let’s calculate the Allan Deviation for both noise data sets, again using the modern overlapping version. You can see in the resulting annotated Sigma-Tau plot below left that all of the WPM data sits almost on top of the green -1 slope line that has been added to the plot for reference. Similarly, the annotated plot below right shows most of the FPM data also sits on top of the -1 slope reference line.
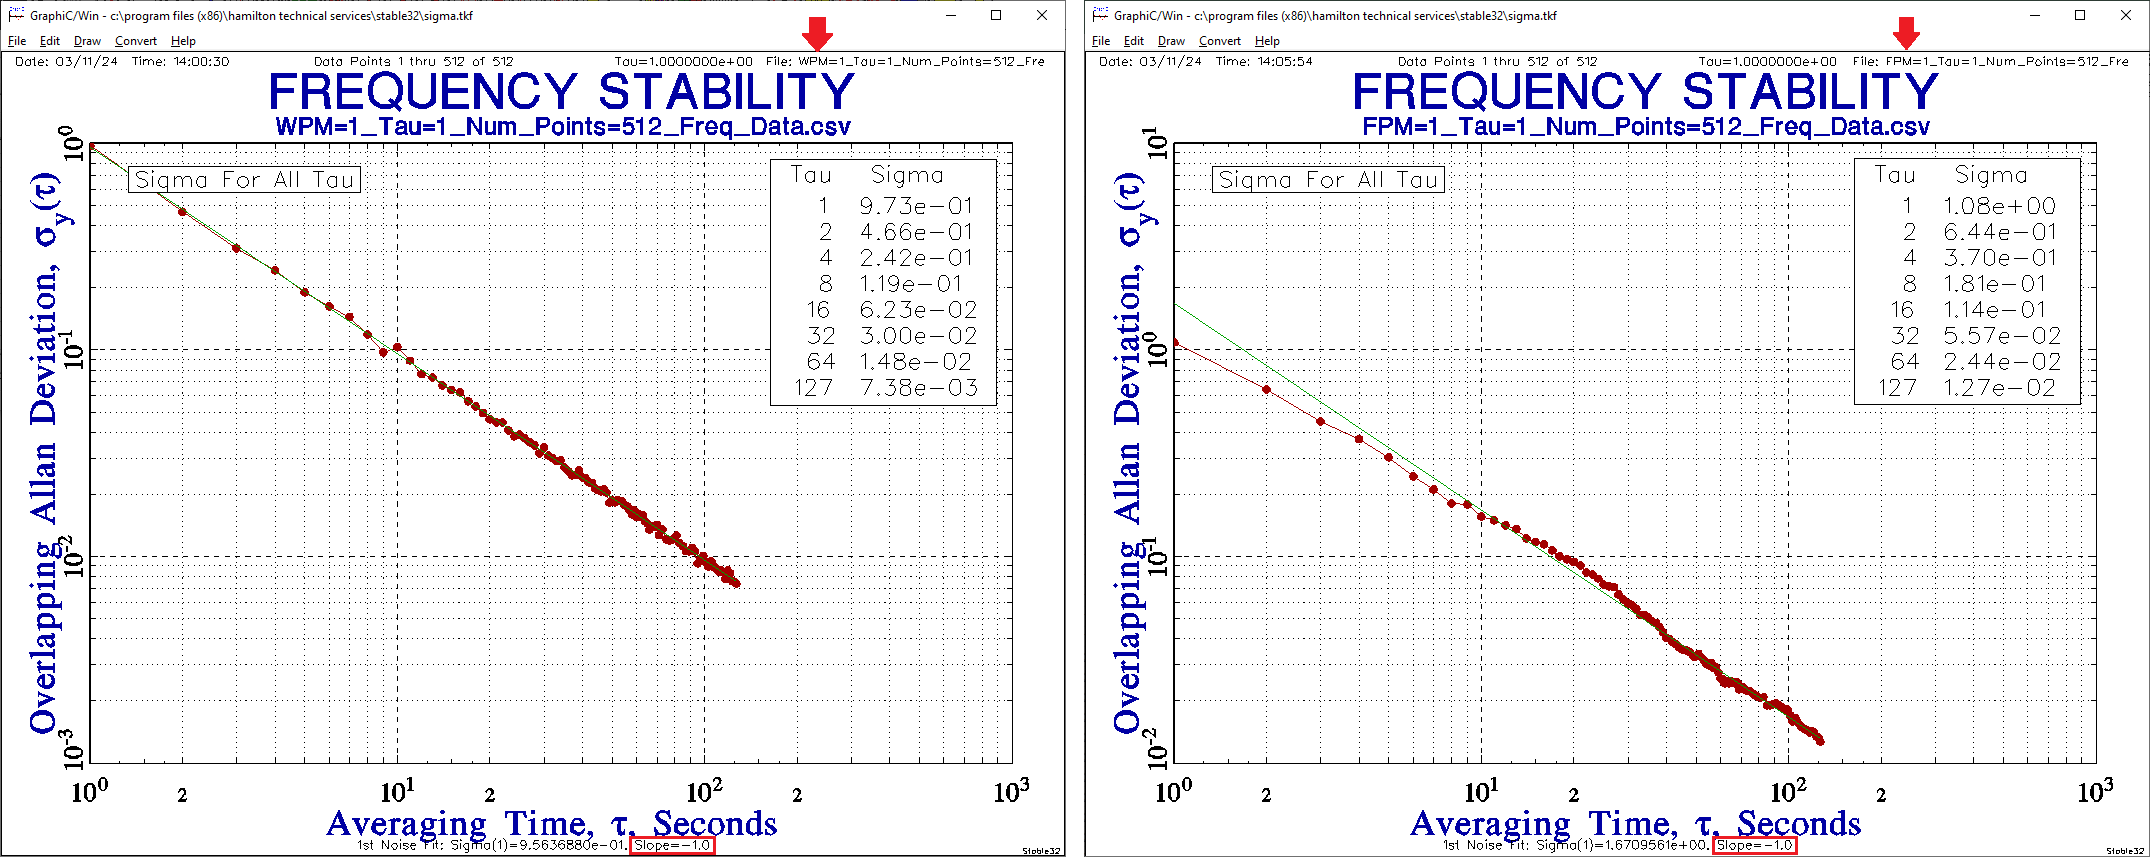
The important take-away here is that the frequency stability plot slopes are essentially the same, i.e., roughly -1 for both WPM and FPM noise processes. You cannot distinguish -1 slope ADEV data as being either white PM or flicker PM noise. Thus, ADEV has a sort of “blind spot” to WPM vs. FPM.
MDEV Modifies ADEV in Order to Distinguish WPM vs. FPM
The two-sample or Allan Variance (AVAR) can be written compactly as follows where averaging time τ is the averaging factor m times the basic measurement interval τ0, i.e. τ = m*τ0. (Calculating and plotting these metrics over different ranges of τ is what makes them informative.) The terms Δy and Δ2x refer to the first and second differences in fractional frequency and phase respectively.
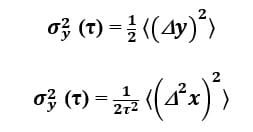
The Modified Allan Variance or MVAR is written similarly as a function of phase data as follows.

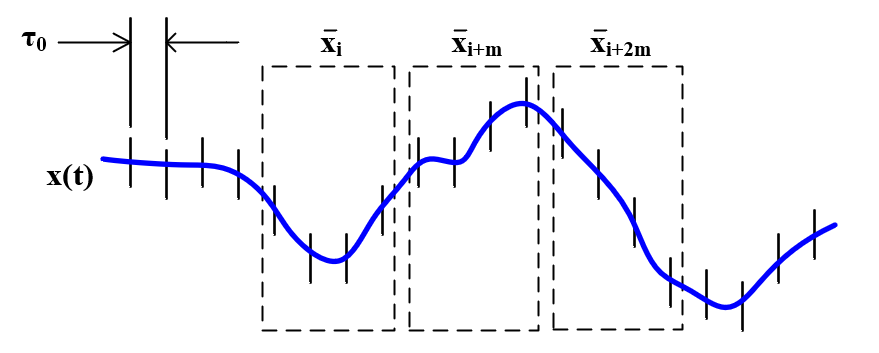
Note the only difference is the averaging overbar. MVAR is proportional to the 2nd difference or double-difference of the phase or time variations averaged over τ. The illustration below, adapted after similar figures in [7] and [8], suggests the basic idea.
Per the Handbook of Frequency Stability Analysis [9], equations (13) and (14), MVAR can be estimated from a set of M frequency measurements, or N = M+ 1 time measurements, respectively as follows.

The Modified Allan Deviation or MDEV is the square root of MVAR and the customary way of analyzing these results.
Now let’s calculate MDEV for the same FPM and WPM data sets as before and see what difference it makes.
The MDEV FPM data below left remains closer to a -1 slope overall as in the previous case though the data look different at larger τ for this dataset. The MDEV WPM data below right falls mostly on a -1.5 slope instead of a -1 slope as before. So WPM noise appears steeper than FPM noise in terms of slope by -1.5 – (-1) = -0.5.
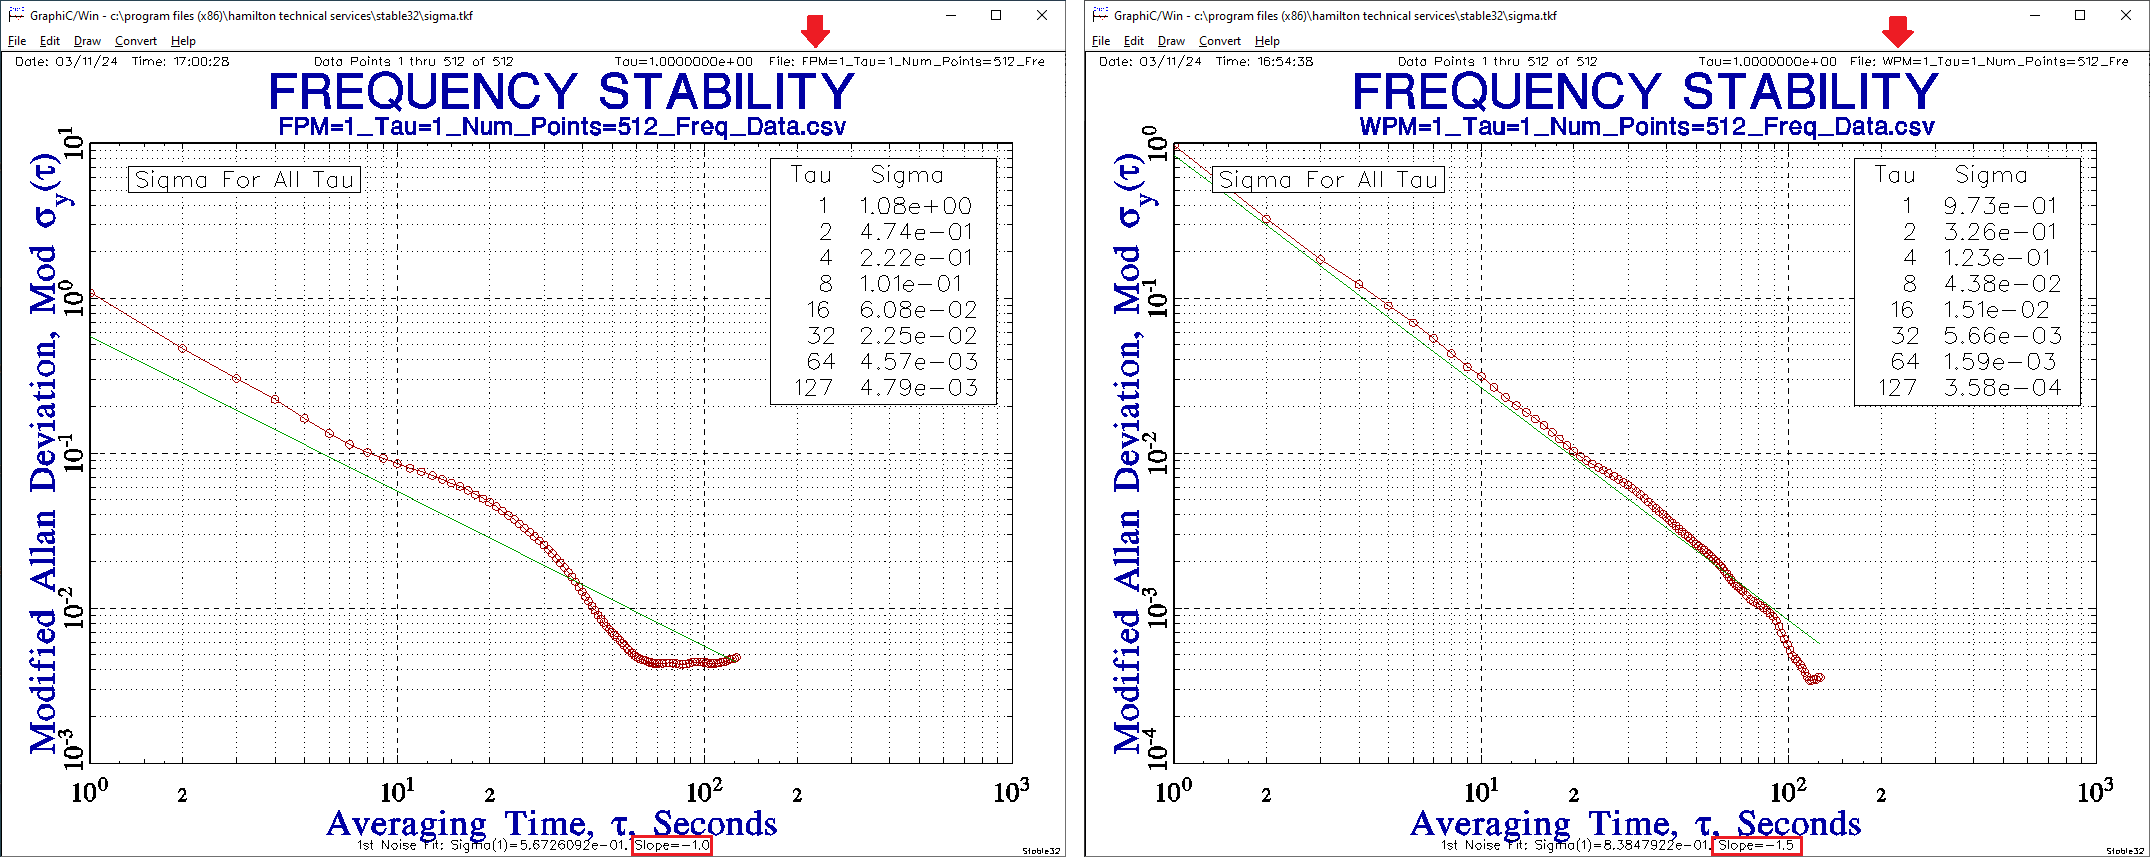
In this example, the additional averaging or smoothing used to calculate MDEV has been demonstrated to distinguish between WPM and FPM noise. As discussed in the next section, MVAR and MDEV are also important as the basis for calculating Time Variance and Time Deviation respectively.
TDEV – A Scaled Version of MDEV Focusing on Time
Time Variance (TVAR) and Time Deviation (TDEV) are simply time scaled versions of the Modified Allan Variance (MVAR) and Modified Allan Deviation (MDEV). This can be seen in equation (15) in the Handbook [9], where Time Variance is written compactly as

Similar to previous metrics, the square root of the Time Variance is the Time Deviation which can therefore be written as follows.

Multiplying MVAR by τ2 in the numerator restores the variance and deviation to expressions involving differences in phase. In particular, we obtain TDEV by multiplying MDEV by τ and dividing (normalizing) by √3 . We will discuss the impact of this special time scaling on TDEV below.
Note that Time Variance σ2x(τ) is written with a subscript “x” instead of a “y” as in Allan Variance σ2y(τ) and Modified Allan Variance Mod σ2y(τ). The focus here is on phase data "x" instead of fractional frequency data "y". As the Handbook explains phase is expressed in units of time error [9].
The x(t) time fluctuations are related to the phase fluctuations by φ (t) = x(t)·2
πν0, where ν0 is the
nominal carrier frequency in hertz. Both are commonly called “phase” to distinguish
them from the independent time variable, t.
Deviations measure the spread of datasets in the same units as the data. Since the Allan Deviation and Modified Allan Deviation metrics are based on fractional frequencies or their phase equivalents, they are dimensionless. However, since TDEV is scaled by τ, it has units of time.
The Modified Allan and Time deviations are so closely related that Stable32 supports plotting MDEV data together with parallel slope TDEV lines as in the example plot below left. We can see at a glance that the example MDEV FPM=1 data has a TDEV between 100 ms and 1 s. This is echoed in the TDEV FPM=1 plot below right where the data is zoomed in and appears to have a slightly flatter negative slope. We will discuss this aspect in more detail in the discussion below.
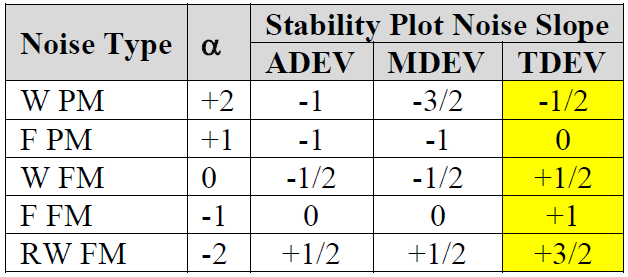
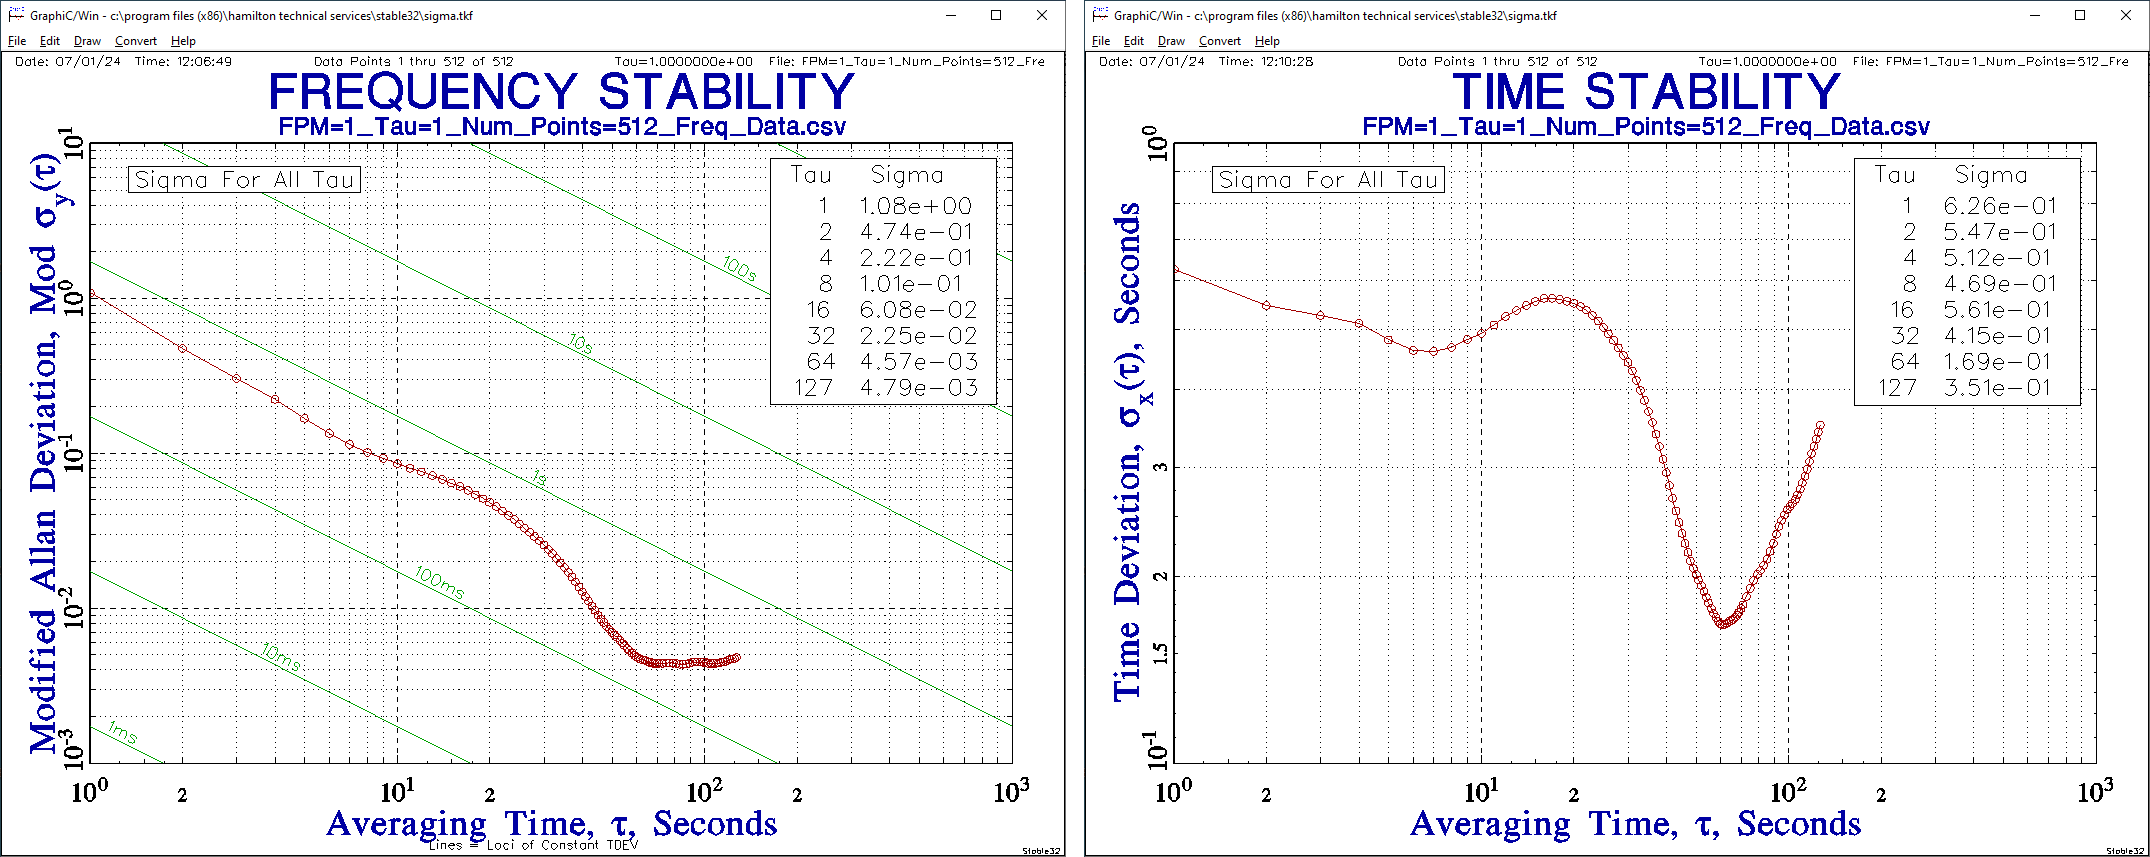 Multiplying MDEV by τ not only results in a deviation metric with units of time but also adds +1 to MDEV stability plot noise slopes. See the highlighted column in the table below adapted after Table 1 in [10].
This multiplication rotates the MDEV Sigma Tau Diagram as indicated below. It “flattens” White PM and Flicker PM by reducing their slopes from τ-3/2 and τ-1 to τ-1/2and τ0 respectively. White FM also flips from τ-1/2 to τ+1/2.
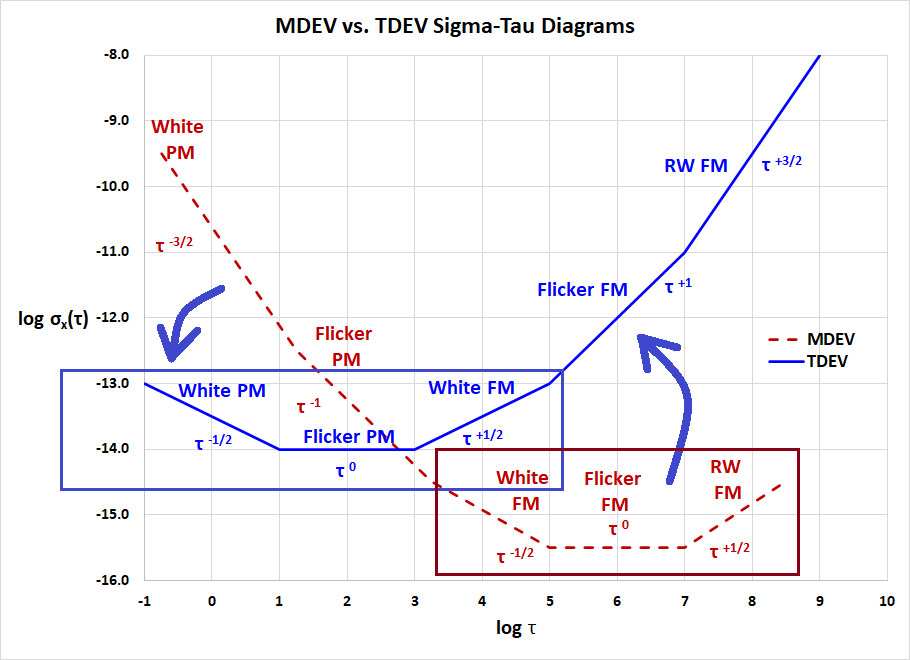
These relatively flattened lowest slope noise types are those most associated with time distribution networks. Per [11]
Synchronization noise types in telecom networks, much like noise in measurement systems, are predominantly white, flicker, and random walk PM.
Note that Random walk PM is another name for White FM [12]. Per [13], White PM and Flicker PM are usually due to gain stages and White FM is a “common type found in passive-resonator frequency standards”.
Normalizing MDEV by √3 has a beneficial statistical property for White PM noise. TDEV, for τ = τ0, is equal to the usual standard deviation of the time data. This property was noted when Time Deviation was first introduced in [14].
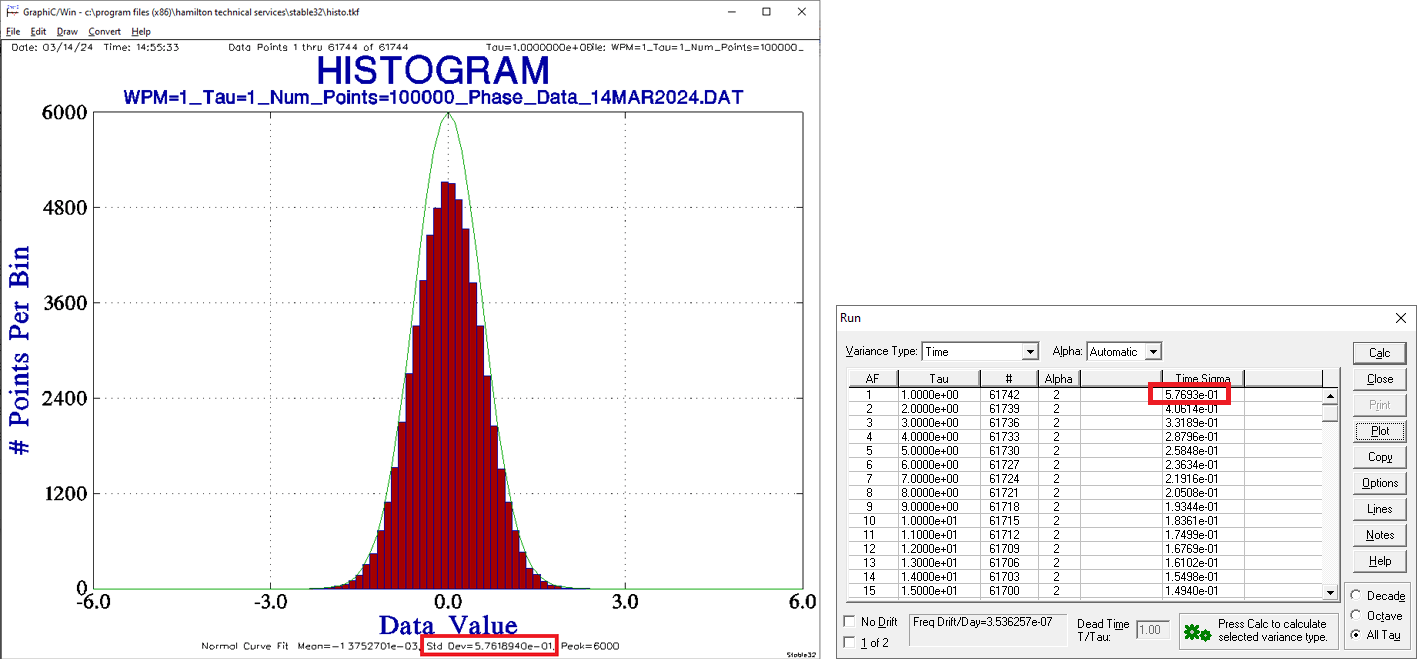
For example, let’s generate a large (100,000 point) phase data set for Tau = 1 and WPM = 1. Then take a histogram of the data and note the standard deviation. In the example below left, it’s 5.7618940e-1 or about 0.58. Now run TDEV on the same dataset. Per the table below right, TDEV for τ = τ0 was calculated to be 5.7693e-01 or about 0.58 as before. In this demonstration, TDEV, for τ = τ0, closely approximated the standard deviation of the time data.
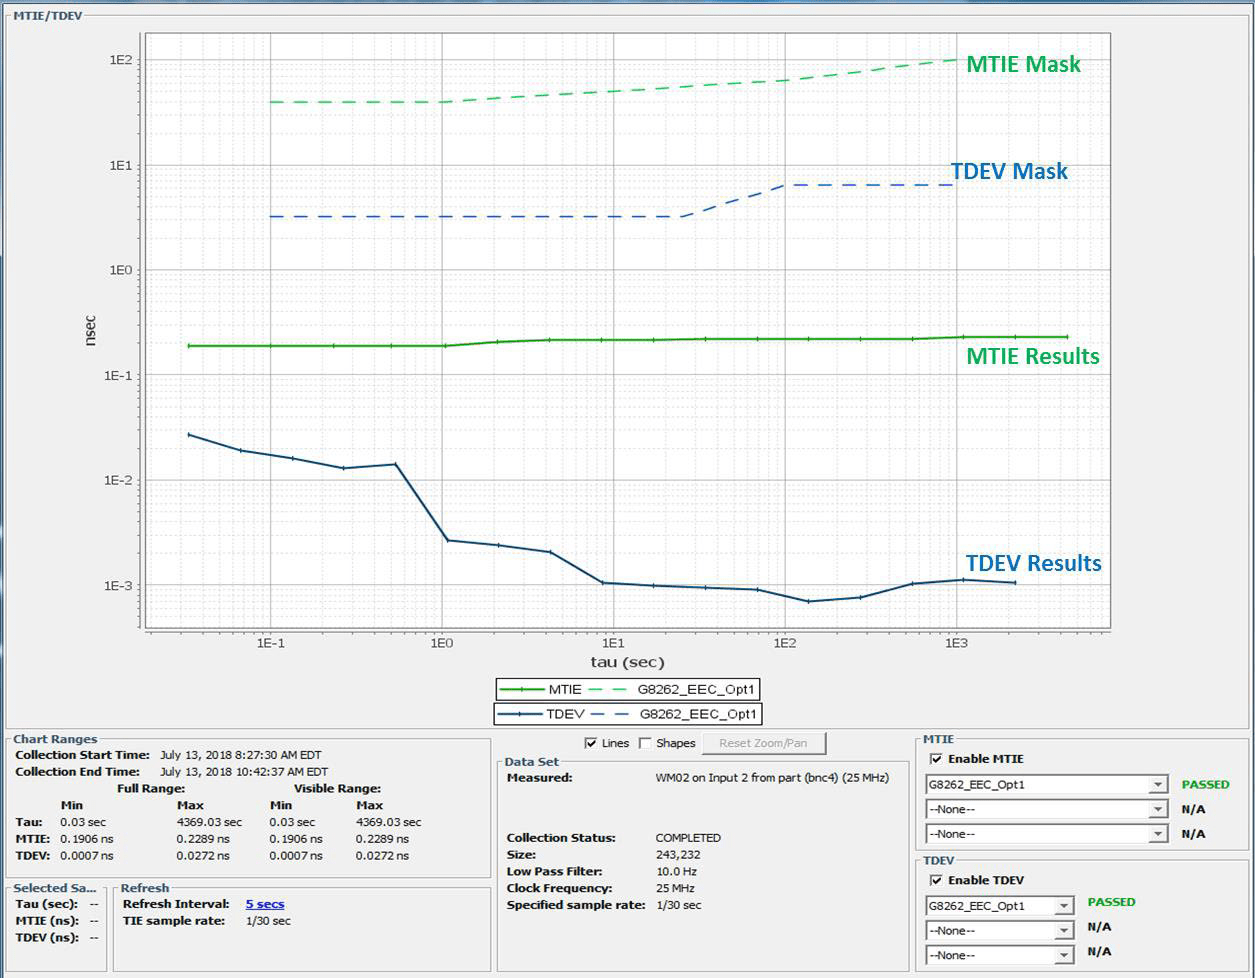
TDEV has proven useful enough for time stability analysis that it has been adopted by the ITU-T (International Telecommunications Union – Telecommunication Standardization Sector) for network clock standards compliance. See ITU-T G.8262 and G.8261 where MTIE and TDEV masks are employed as limits to wander generation, wander tolerance, and wander transfer [15] [16]. Below is an example test result for an Si5348 Rev E clock device passing the G.8262 EEC Option 1 Wander Generation limits.
Summary
Now that we have introduced the principal members of the Allan Deviation family we can summarize the main points in the table below. Extending the family analogy, one can regard Allan Deviation as being the “Grandfather” of Time Deviation.

The older deviation metrics, ADEV and MDEV, while not associated with normative limits, are still very useful as analysis tools.
A good overall document comparing time stability quantities of interest to standards bodies is ITU-T Recommendation G.810 [17]. Appendix II lists the definition, formulas, noise performance, frequency offset and drift performance, and pros and cons, for each of the 5 quantities below. All of these have been introduced in this 3-part blog series except for TIErms which is less commonly used.
- Allan Deviation (ADEV)
- Modified ADEV (MDEV)
- Time Deviation (TDEV);
- Root mean square Time Interval Error (TIErms)
- Maximum Time Interval Error (MTIE).
I hope you have enjoyed this Timing 201 article. I was only able to highlight the most important points. References are appended for readers that want to dive deeper into these time stability metrics and their applications.
As always, if you have topic suggestions or questions appropriate for this blog, please send them to kevin.smith@skyworksinc.com with the words Timing 201 in the subject line. I will give them consideration and see if I can fit them in. Thanks for reading.
Cheers,
Kevin
References
[1] K. Smith, "Timing 201 #9: The Case of the Really Slow Jitter – Part 1", Timing 201. 2021 [Online].
https://www.skyworksinc.com/Blog/2022/10/Timing-201-09
[2] K. Smith, "Timing 201 #10: The Case of the Really Slow Jitter – Part 2", Timing 201. 2021 [Online].
https://www.skyworksinc.com/Blog/2022/10/Timing-201-10
[3] D. A. Howe and T. N. Tasset, "Clock jitter estimation based on PM noise measurements," IEEE International Frequency Control Symposium and PDA Exhibition Jointly with the 17th European Frequency and Time Forum, 2003. Proceedings of the 2003, Tampa, FL, USA, 2003, pp. 541-546, doi: 10.1109/FREQ.2003.1275149.
https://tf.nist.gov/general/pdf/1895.pdf
[4] "1139-2008 - IEEE Standard Definitions of Physical Quantities for Fundamental Frequency and Time Metrology---Random Instabilities", Ieeexplore.ieee.org, 2008. [Online]. Available: https://ieeexplore.ieee.org/stamp/stamp.jsp?tp=&arnumber=4797525&tag=1.
[5] D. Leeson, "Oscillator Phase Noise: A 50-Year Review", IEEE Transactions on Ultrasonics, Ferroelectrics, and Frequency Control, vol. 63, no. 8, pp. 1208-1225, 2016 [Online]. Available: https://ieeexplore.ieee.org/stamp/stamp.jsp?arnumber=7464875.
[6] W. Riley, "Stable32 - Software for Frequency Stability Analysis, by William Riley | IEEE UFFC", IEEE UFFC, 2018. [Online]. Available: https://ieee-uffc.org/technical-committees/frequency-control/educational-resources/frequency-control-software
[7] IEEE Std1139-2008 IEEE Standard Definitions of Physical Quantities for Fundamental Frequency and Time Metrology - Random Instabilities, previously cited.
See Annex C.3 Modified Allan deviation Mod σy(τ) example and Figure C.3 — Method for calculating x ks, and y 'ks for Mod σy(τ).
[8] J. Marc, W. Gov, and K. Shenoi, “TDEV -Then and Now.” Accessed: Apr. 20, 2024. [Online]. Available: https://www.telecom-sync.com/files/pdfs/itsf/2015/day3/1130_Weiss_Shenoi_TDEV-Then_and_Now_ITSF-2015_v.20151022.pdf
[9] W. Riley, “Handbook of Frequency Stability Analysis.” Accessed: Apr. 20, 2024. [Online]. Available: https://tf.nist.gov/general/pdf/2220.pdf
Note: A version of this handbook aka NIST Special Publication 1065, and many other excellent related papers are available on Mr. Riley’s Hamilton Technical Services website at https://www.wriley.com/.
[10] W. Riley, “Learn Frequency Stability Analysis Using Stable32,” 2020. Accessed: Apr. 20, 2024. [Online]. Available: https://ieee-uffc.org/files/ieeeuffcorg/2022-03/Learn-Frequency-Stability-Analysis-Using-Stable32.pdf
[11] M. A. Weiss and K. Shenoi, "The Time Deviation in Packet-Based Synchronization," in IEEE Transactions on Ultrasonics, Ferroelectrics, and Frequency Control, vol. 63, no. 4, pp. 531-537, April 2016, doi: 10.1109/TUFFC.2015.2495011
https://ieeexplore.ieee.org/stamp/stamp.jsp?tp=&arnumber=7307700
[12] M. Weiss, “Assisted Partial Timing Support: Predicting Time Dispersion Aka: Optimal Estimation, Prediction, and Ensembling Of Timing Signals.” Accessed: Apr. 19, 2024. [Online]. Available: https://wsts.atis.org/wp-content/uploads/2018/11/3-2_NIST_Weiss_APTS_Prediction.pdf
See pages 4 and 6.
[13] “Section Twelve,” tf.nist.gov. https://tf.nist.gov/phase/Properties/twelve.htm (accessed Apr. 19, 2024).
See XII. Causes of Noise Properties in a Signal Source, 12.1 Power-law Noise Processes.
[14] D.W. Allan, D.D. Davis, J. Levine, M.A. Weiss, N. Hironaka, and D. Okayama, “New inexpensive frequency calibration service from Natl. Inst. Stand. Technol.,” Proc. 44th Freq. Cont. Symp., pp. 107-116 (June 1990). Accessed: Apr. 22, 2024. [Online]. Available: https://tf.nist.gov/general/pdf/889.pdf
[15] “G.8262 : Timing characteristics of synchronous equipment slave clock,” www.itu.int. https://www.itu.int/rec/T-REC-G.8262 (accessed Apr. 22, 2024).
[16] “G.8262.1 : Timing characteristics of enhanced synchronous equipment slave clock,” www.itu.int. https://www.itu.int/rec/T-REC-G.8262.1 (accessed Apr. 22, 2024).
[17] “G.810 : Definitions and terminology for synchronization networks,” www.itu.int. https://www.itu.int/rec/T-REC-G.810 (accessed Apr. 26, 2024).

By Kevin G. Smith
Sr. Principal Applications Engineer


